What does “central tendency” mean?
Measures of central tendency are methods to find a single number that represents the “center” of a dataset.
1) Mean (Arithmetic Mean)
Meaning (simple)
Mean is the “usual average.” It is found by adding all values and dividing by how many values are there.
Formula
If values are 𝓍1,𝓍2,𝓍3,…,𝓍n
Example (Marks)
Data: 2, 3, 3, 4, 8
=52+3+3+4+8=520=4
2) Median
Meaning (simple)
Median is the middle value when the data is arranged in ascending order.
Steps
First sort the data.
- If n is odd, Median = middle value
- If n is even, Median = average of the two middle values
Formula / Position
- If n is odd: Median is at position
- If n is even: Median is average of values at positions and ( )
Example (odd n)
Data (sorted): 2, 3, 3, 4, 8
so middle position
3rd value is 3, so Median = 3
3) Mode
Meaning
Mode is the value that occurs most frequently.
“Formula”
There’s no fixed formula just count frequencies and find the highest.
Example
Data: 2, 3, 3, 4, 8 3 occurs two times (highest), so Mode = 3
One diagram that students understand quickly
Data (sorted)
2, 3, 3, 4, 8
Number line diagram (text diagram you can copy into your paper)
2 3 3 4 8
|---|---|---|---|
↑
Median = 3
Mode = 3 (comes most)
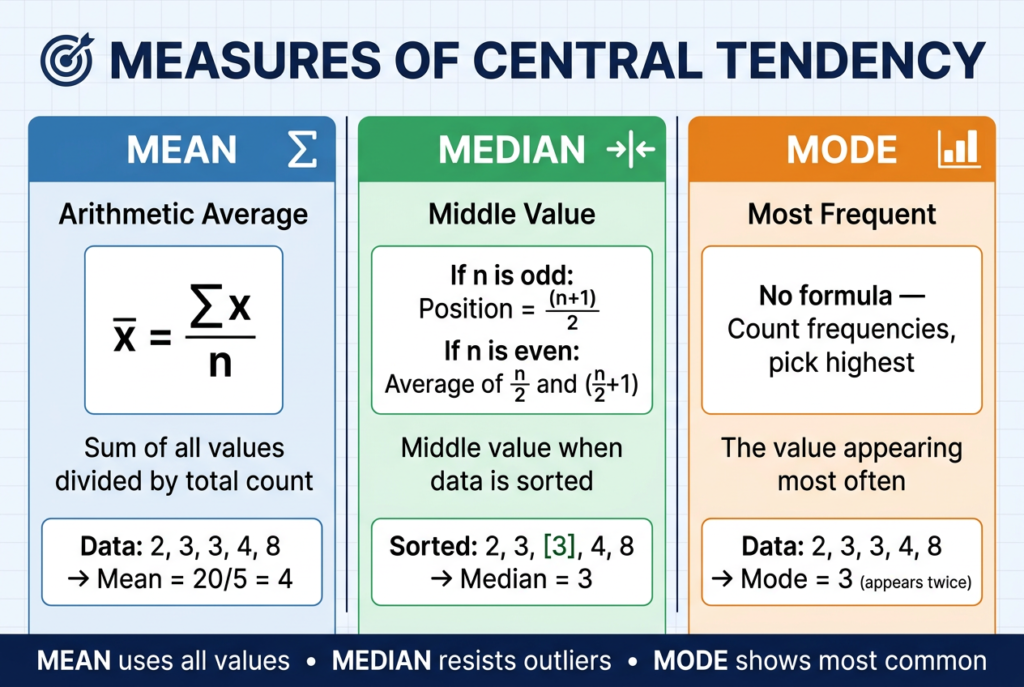
Mean = 4 (because total 20 ÷ 5 = 4)Quick comparison (very important in exams)
Mean uses all values (can change a lot if one value is very big or very small).
Median is the middle (best when there are outliers).
Mode is the most common (useful for “most repeated” value).
Swathika B is an MBA graduate in Finance & Business Analytics , the founder of The Commerce Lab. With a strong academic foundation in B.Com BFSI and hands-on experience in financial analysis, data analytics, and business studies, she created this platform to make Commerce and Accountancy simple, practical, and exam-ready for students across India.