Data refers to raw facts, figures, and information collected for analysis. In statistics, data is classified into different types based on its nature and measurement. Proper understanding of data classification helps researchers, students, and businesses choose the correct statistical tools and methods.
Classification of Data
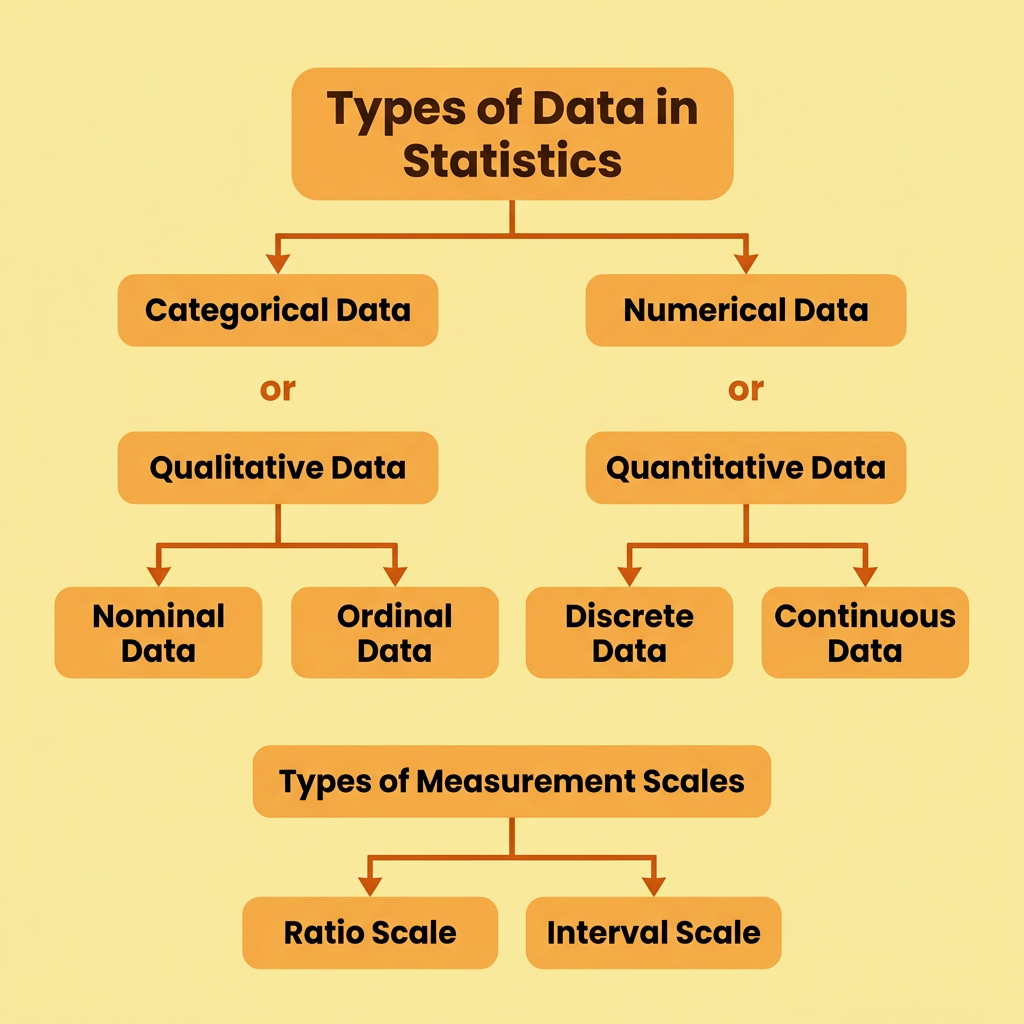
Data is mainly divided into two major categories:
- Qualitative Data
- Quantitative Data
A. Qualitative Data
Qualitative data is also known as categorical data. It describes qualities, characteristics, opinions, or labels rather than numbers.
Examples:
- Gender
- Religion
- Brand Name
- Customer Satisfaction
- Color Preference
Qualitative data is further divided into:
i) Nominal Data
Nominal data refers to data that is grouped into categories without any order or ranking.
Examples:
- Gender: Male / Female
- Blood Group: A, B, AB, O
- Religion
- Nationality
ii) Ordinal Data
Ordinal data refers to data arranged in a meaningful order or ranking.
Examples:
- Customer Satisfaction: Poor, Average, Good, Excellent
- Class Rank: First, Second, Third
- Education Level: School, College, Postgraduate
B. Quantitative Data
Quantitative data refers to numerical data that can be measured or counted.
Examples:
- Sales Revenue
- Number of Employees
- Height
- Weight
- Age
Quantitative data is further divided into:
i) Discrete Data
Discrete data consists of whole numbers and cannot include fractions or decimals.
Examples:
- Number of Students in a Class
- Number of Cars Sold
- Number of Employees in a Company
- Number of Mobile Phones Owned
ii) Continuous Data
Continuous data can take any value within a range, including fractions and decimals.
Examples:
- Height
- Weight
- Temperature
- Distance
- Time
Difference Between Qualitative Data and Quantitative Data
| Basis of Difference | Qualitative Data | Quantitative Data |
|---|---|---|
| Meaning | Refers to descriptive information | Refers to numerical information |
| Nature | Non-numeric data | Numeric data |
| Purpose | Describes qualities and characteristics | Measures quantities and values |
| Examples | Gender, color, customer opinion | Profit, age, revenue, salary |
| Collection Method | Interviews, observations, surveys | Measurements, calculations, counts |
Difference Between Discrete Data and Continuous Data
| Basis of Difference | Discrete Data | Continuous Data |
|---|---|---|
| Meaning | Can take only whole-number values | Can take any value within a range |
| Values | No decimals or fractions | Includes decimals and fractions |
| Nature | Countable | Measurable |
| Collection Method | Collected through counting | Collected through measurement |
| Examples | Number of students, number of cars | Height, weight, temperature |
| Graph Used | Bar chart, pie chart | Histogram, line graph |
Types of Measurement Scales
Measurement scales are used to classify and measure data. There are four main types of scales:
1. Nominal Scale
Nominal scale is used to classify data into categories without any order.
Examples:
- Gender
- Religion
- Blood Group
- Marital Status
2. Ordinal Scale
Ordinal scale is used when the data has a meaningful order or ranking.
Examples:
- Satisfaction Level
- Exam Rank
- Class Position
3. Interval Scale
Interval scale has equal intervals between values, but there is no true zero point.
Examples:
- Temperature in Celsius
- Calendar Years
- IQ Scores
4. Ratio Scale
Ratio scale has equal intervals and a true zero point.
Examples:
- Height
- Weight
- Income
- Age
Difference Between Interval Scale and Ratio Scale
| Basis of Difference | Interval Scale | Ratio Scale |
|---|---|---|
| Zero Point | No true zero | Has a true zero |
| Meaning of Zero | Zero does not mean absence | Zero means absence |
| Example | Temperature in Celsius | Weight, Height, Income |
| Mathematical Operations | Addition and subtraction only | All mathematical operations possible |
Business Example
Consider a company like Reliance Jio.
- Customer gender is Qualitative Data.
- Customer satisfaction level is Ordinal Data.
- Number of subscribers is Discrete Data.
- Internet speed is Continuous Data.
- Monthly revenue is Quantitative Data.
This shows how businesses use different types of data to understand customer behavior and improve their performance.
Importance of Data Classification
- Helps organize data properly
- Makes analysis easier
- Improves accuracy in research
- Helps select suitable statistical tools
- Supports better decision-making
- Makes reports easier to understand
Exam Questions and Answers
1. What is Qualitative Data?
Answer: Qualitative data refers to descriptive information that explains qualities, characteristics, and opinions rather than numbers.
2. What is Quantitative Data?
Answer: Quantitative data refers to numerical information that can be counted, measured, or analyzed mathematically.
3. What is the difference between Discrete Data and Continuous Data?
| Discrete Data | Continuous Data |
|---|---|
| Takes only whole-number values | Can take decimal values |
| Countable | Measurable |
| Example: Number of students | Example: Height |
4. What is Nominal Data?
Answer: Nominal data is categorical data without any order or ranking.
5. What is Ordinal Data?
Answer: Ordinal data is categorical data arranged in a meaningful order.
Swathika B is an MBA graduate in Finance & Business Analytics , the founder of The Commerce Lab. With a strong academic foundation in B.Com BFSI and hands-on experience in financial analysis, data analytics, and business studies, she created this platform to make Commerce and Accountancy simple, practical, and exam-ready for students across India.