The most repeated value in your data — explained the way an Indian examiner expects: formula, substitution, simplification, and a clean final answer with units (₹, kg, marks).
What is the Mode?
The mode is the value that occurs most frequently in a data set. While the mean tells you the arithmetic centre and the median tells you the positional centre, the mode tells you the typical or most popular value
EXAMPLES : the size of shoes that sells the most in a Bata showroom, the most common monthly rent in a Mumbai chawl, or the marks scored by the largest group of students in a CBSE class.
A data set may have one mode (unimodal), two modes (bimodal), more than two (multimodal), or no mode at all if every value appears the same number of times.
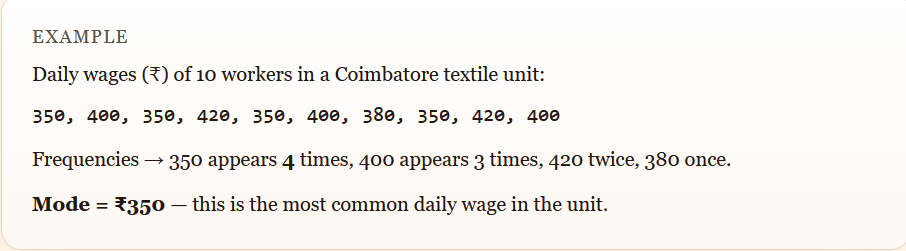
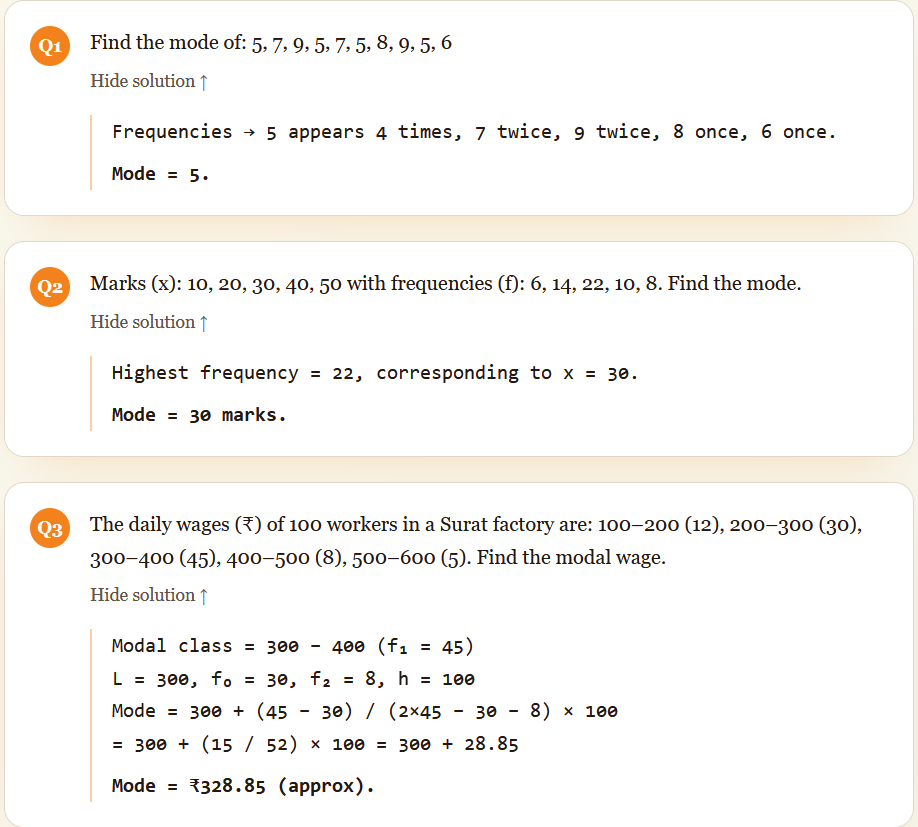
1) Mode of Raw (Ungrouped) Data
Step 1 — Inspect the data
Look at all the observations and identify the value that appears the maximum number of times. For small data sets, just counting is enough.
Step 2 — Tally if the data is large
For longer lists, prepare a small frequency table (value vs. number of times it occurs). The value with the highest frequency is the mode.
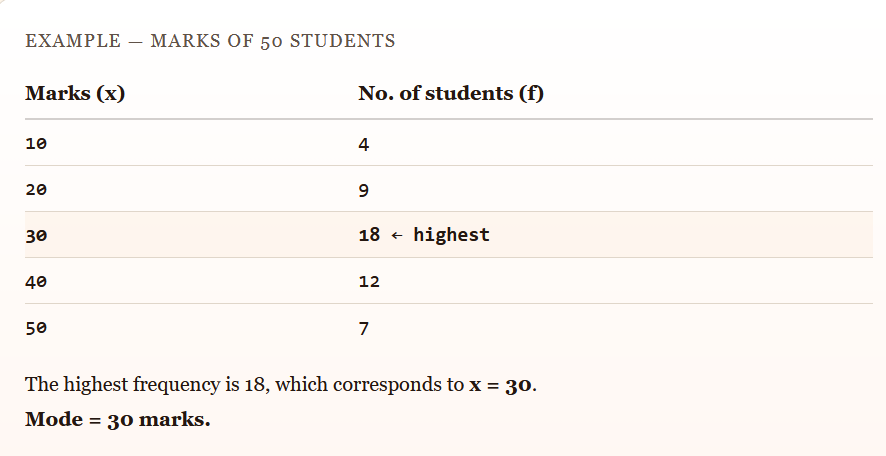
2) Mode of a Discrete Frequency Distribution
When data is given as values (x) with their frequencies (f), the mode is simply the value of x with the highest frequency. This method is called Inspection Method.
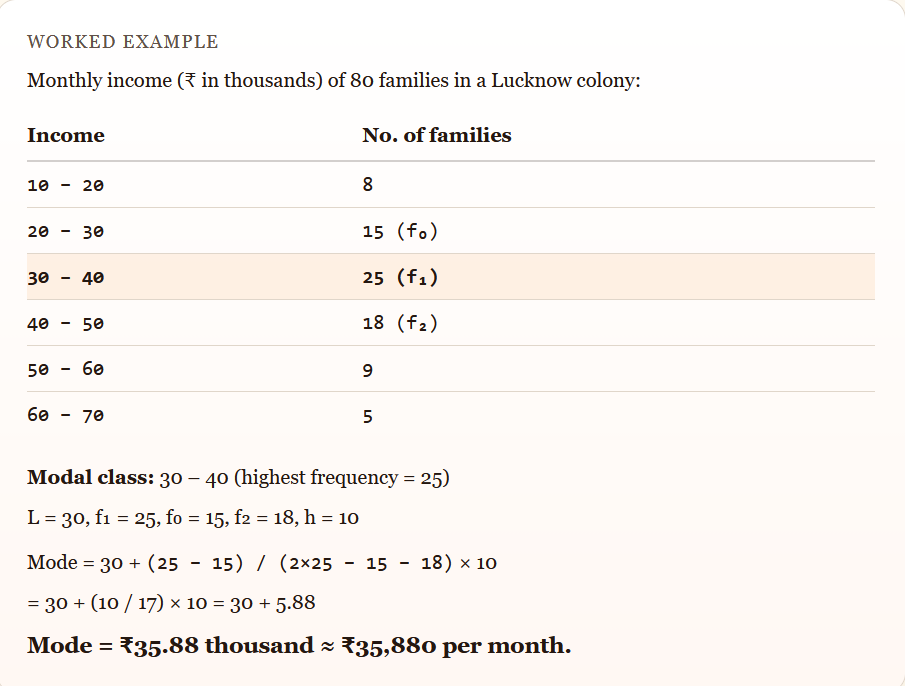
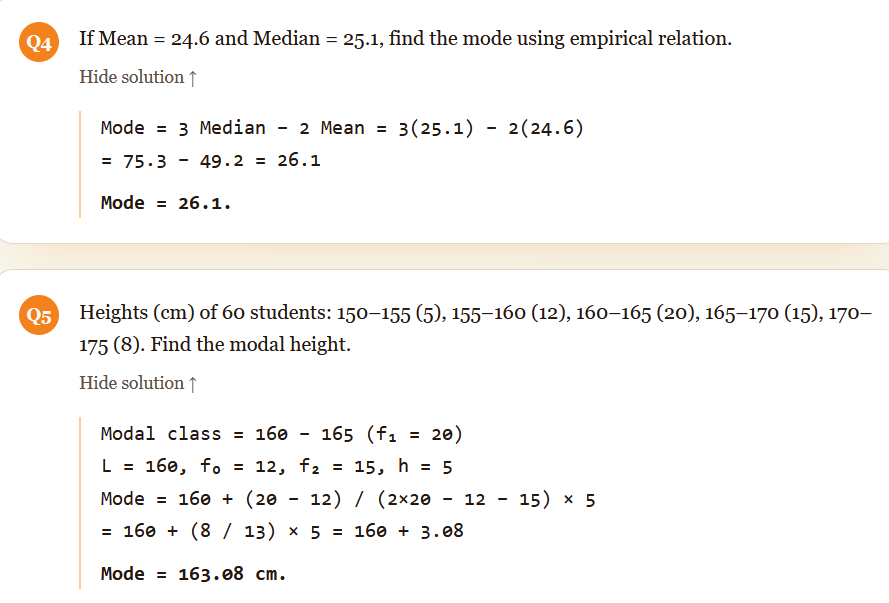
3) Mode of a Continuous (Grouped) Frequency Distribution
For class intervals, first locate the modal class — the class with the highest frequency. Then apply the formula:
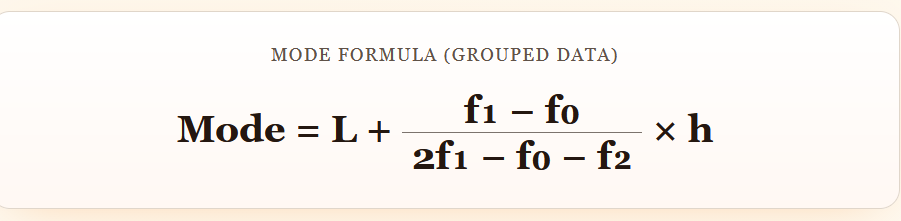
Where:
- L = lower limit of the modal class
- f₁ = frequency of the modal class
- f₀ = frequency of the class before the modal class
- f₂ = frequency of the class after the modal class
- h = class width (size of the class interval)
Empirical Relation (Karl Pearson)
For a moderately asymmetrical distribution, mean, median and mode are connected by:

Practice Sums – Score Full Marks
Try each problem on paper first. Every solution is written the way an Indian board / university examiner expects: formula, substitution, simplification, and final answer with units.
Tips to Score Full Marks
- ✓For grouped data, identify the modal class first and write “highest frequency = …” as a one-line reason.
- ✓Always write the formula first, then substitute. Examiners give step marks even if the final answer is wrong.
- ✓Be careful with f₀ (class before) and f₂ (class after) — swapping them is the most common silly mistake.
- ✓For continuous data with unequal class intervals, first make them equal (or use frequency density) before applying the formula.
- ✓Always include units (₹, marks, kg, cm, years) in the final answer.
- ✓Round only at the final step, usually to 2 decimal places.
Swathika B is an MBA graduate in Finance & Business Analytics , the founder of The Commerce Lab. With a strong academic foundation in B.Com BFSI and hands-on experience in financial analysis, data analytics, and business studies, she created this platform to make Commerce and Accountancy simple, practical, and exam-ready for students across India.