The simplest measure of dispersion in statistics — explained the way an Indian examiner expects: clean formula, neat substitution, and a final answer with units (₹, mm, kg, marks).
1) What is Range?
The range is the difference between the largest and the smallest value in a data set. It is the easiest and quickest way to measure how spread out the data is — the gap between the highest monsoon rainfall in Cherrapunji and the lowest in Jaisalmer, between the costliest and cheapest tomato price in a Chennai mandi, or between the topper’s and the lowest scorer’s marks in a CBSE board paper.
A small range means the values are close together (consistent, less variation). A large range means the values are scattered widely (more variation, more risk).
2) Formula
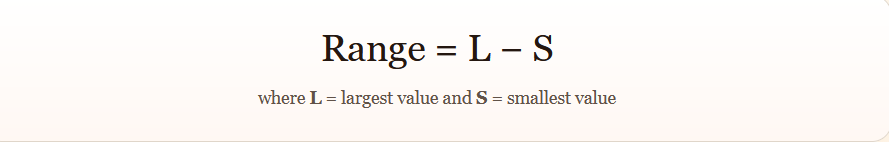
For ungrouped or discrete data
simply identify the largest and smallest observation and subtract:
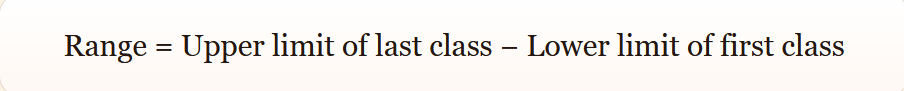
For grouped (continuous) data
Take the upper limit of the highest class as L and the lower limit of the lowest class as S
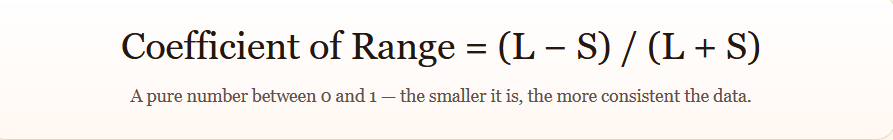
3) Coefficient of Range
The plain range carries units (₹, kg, mm). To compare two data sets measured in different units say, rainfall in millimetres and rice production in tonnes we use a unit-free relative measure called the Coefficient of Range.
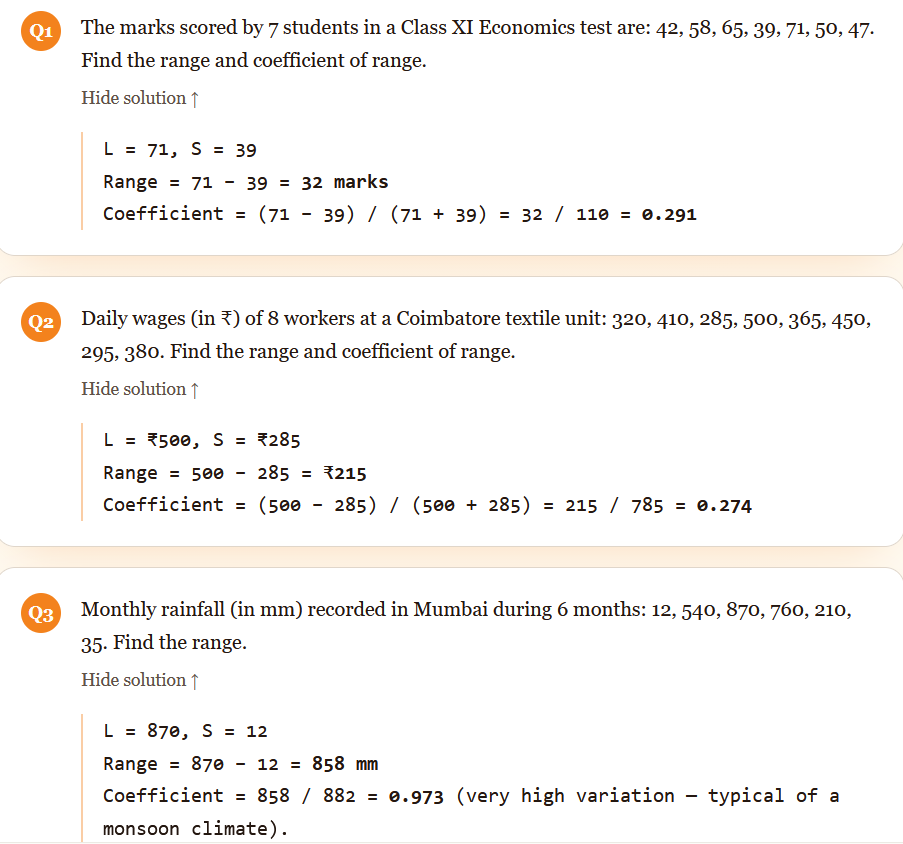
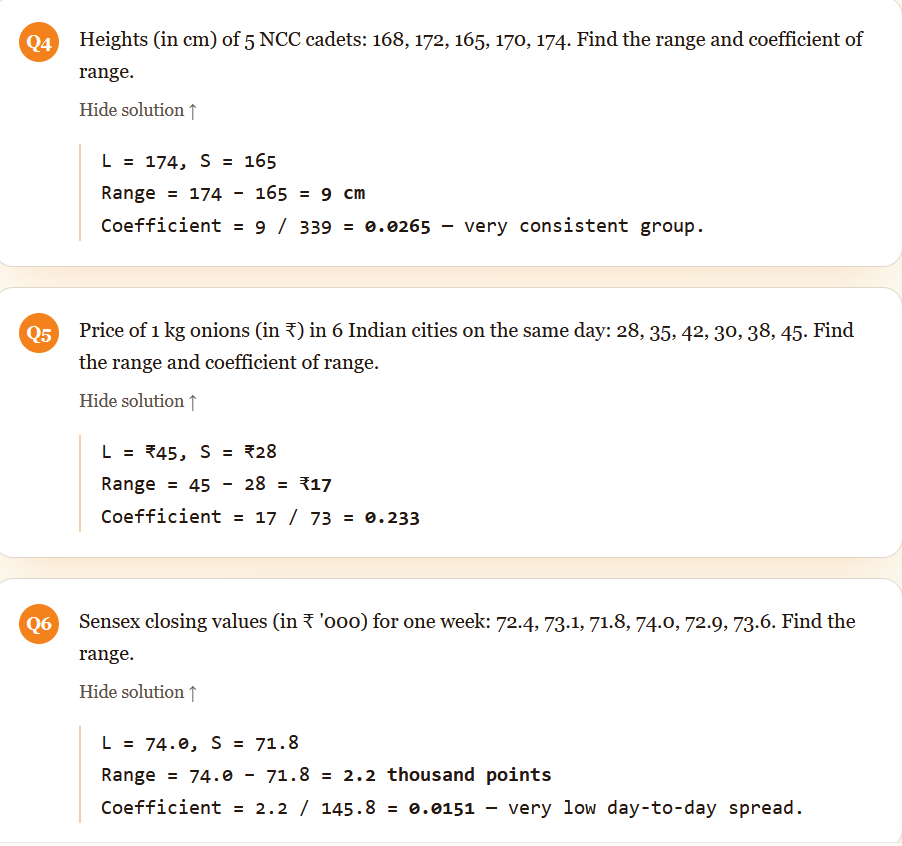
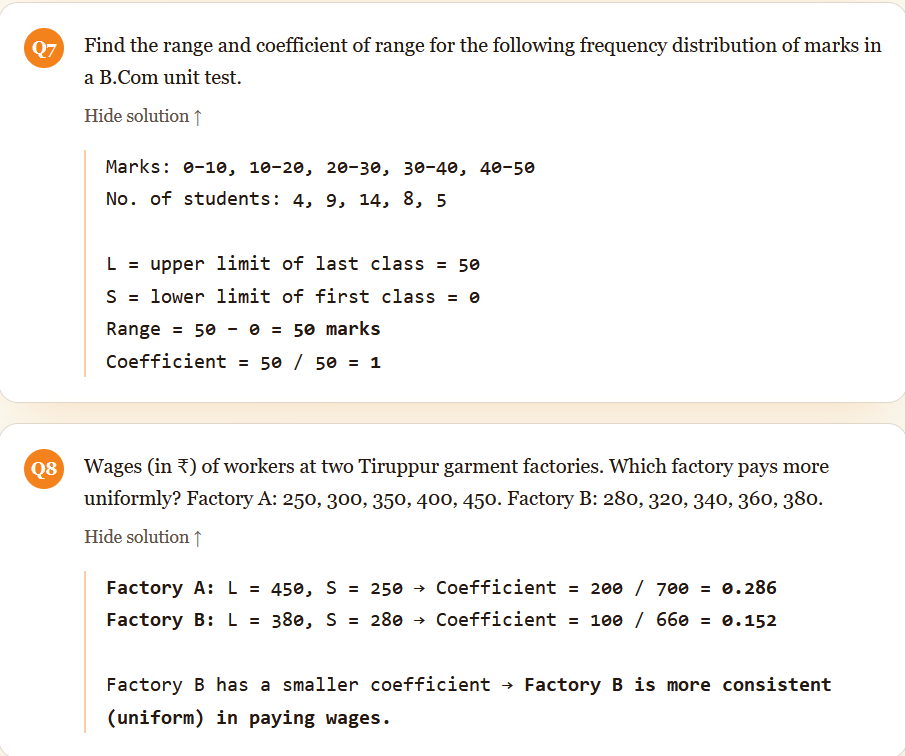
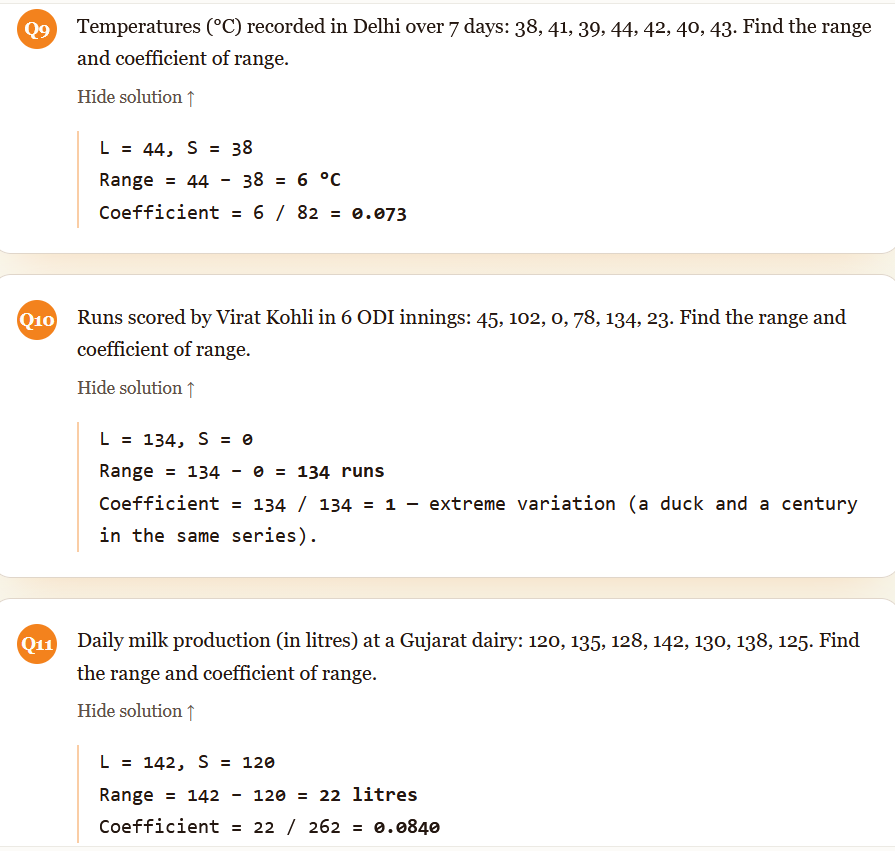
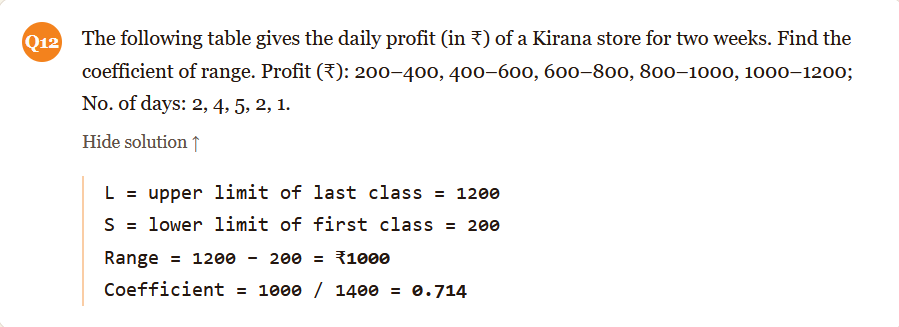
4) Solved Problems
Click any question to expand the step-by-step solution.
5) When to use Range
- Quality control in factories — to monitor variations in product weight, length or thickness on an assembly line.
- Stock market & commodity reports — daily high–low spread of Sensex, Nifty, gold and silver.
- Weather reports — daily maximum and minimum temperature, monthly rainfall variation.
- Quick comparisons when you need a fast, rough idea of spread without calculating mean or standard deviation.
6) Limitations
- Affected by extreme values (outliers). One unusually high or low value can completely distort the range — a single duck by Kohli changed the range from a small number to 134.
- Ignores the middle values. Only L and S are used; the distribution between them is not considered at all.
- Not suitable for open-ended classes (like “Below 10” or “Above 100”) since L or S cannot be defined.
- Not based on every observation, so it is not a reliable measure for serious statistical analysis — use standard deviation or quartile deviation instead.
- Cannot be calculated for qualitative data (colour, religion, gender).
Swathika B is an MBA graduate in Finance & Business Analytics , the founder of The Commerce Lab. With a strong academic foundation in B.Com BFSI and hands-on experience in financial analysis, data analytics, and business studies, she created this platform to make Commerce and Accountancy simple, practical, and exam-ready for students across India.