1) What is Quartile Deviation?
Quartile Deviation is half the distance between the upper quartile (Q3) and the lower quartile (Q1). Instead of looking at the extreme ends like Range does, it looks at the middle 50% of the data — the calm centre, ignoring the noisy tails.
Picture a Mumbai local at 8 a.m. The first compartment is empty (Q1, the bottom 25%). The last is empty (Q3 onwards, the top 25%). The middle bogies are jam-packed — that’s the interquartile range, and Q.D. is just half of it.
2) Q1 and Q3
- Q1 (Lower Quartile): the value below which 25% of observations lie.
- Q2 (Median): the value below which 50% lie.
- Q3 (Upper Quartile): the value below which 75% lie.
The gap (Q3 − Q1) is called the Interquartile Range. Half of it is our hero today.
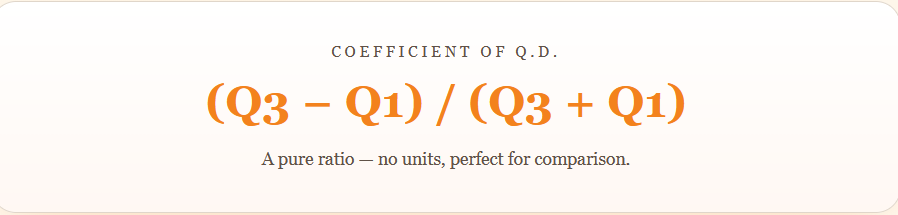
3) The Formula

4) Coefficient of Quartile Deviation
Q.D. has units (₹, kg, marks). To compare dispersion across two different things — say wages in Delhi vs marks in a class — we need a unitless number. That’s the coefficient.
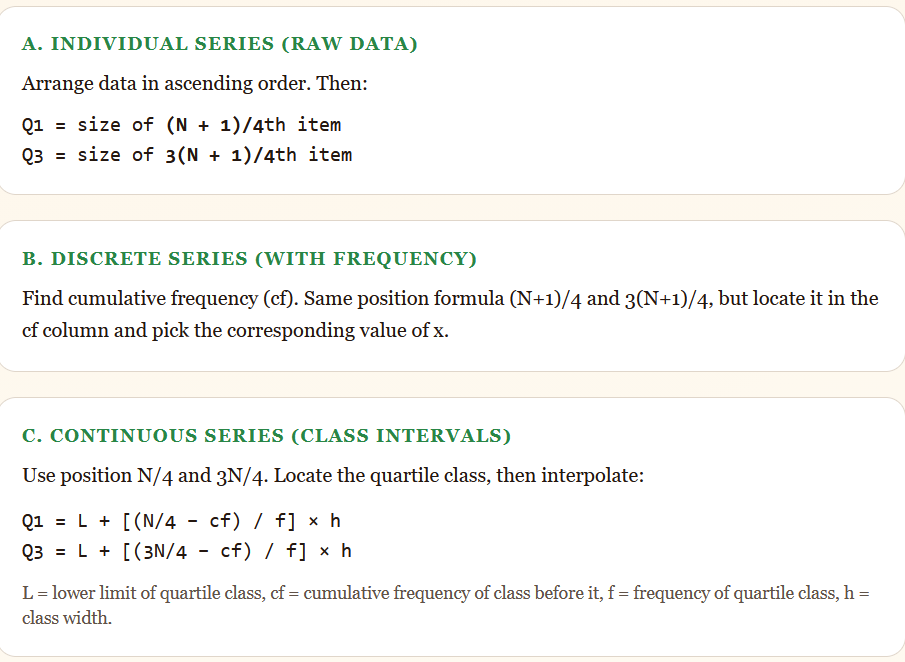
5) Three series — three methods
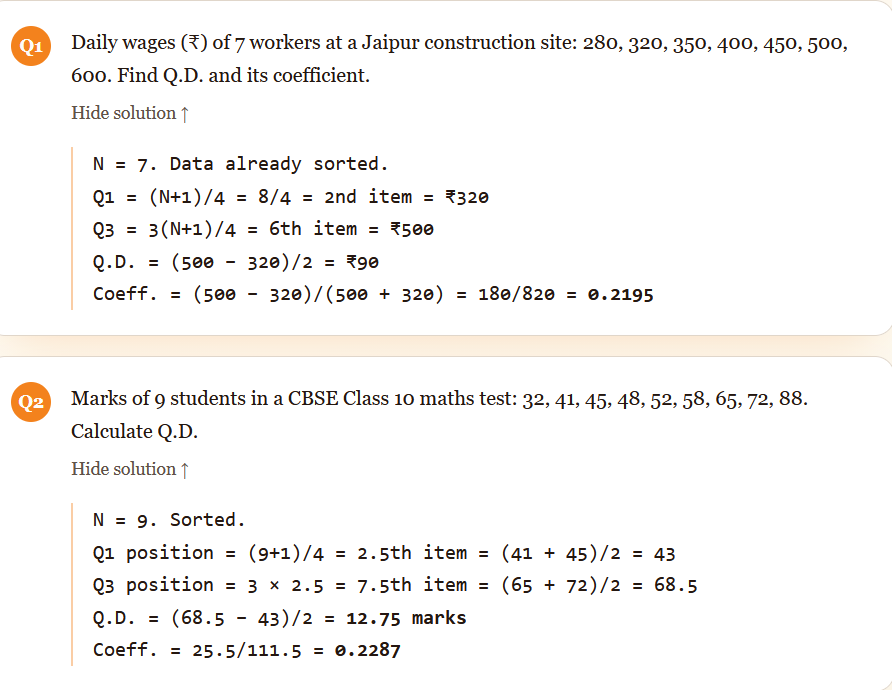
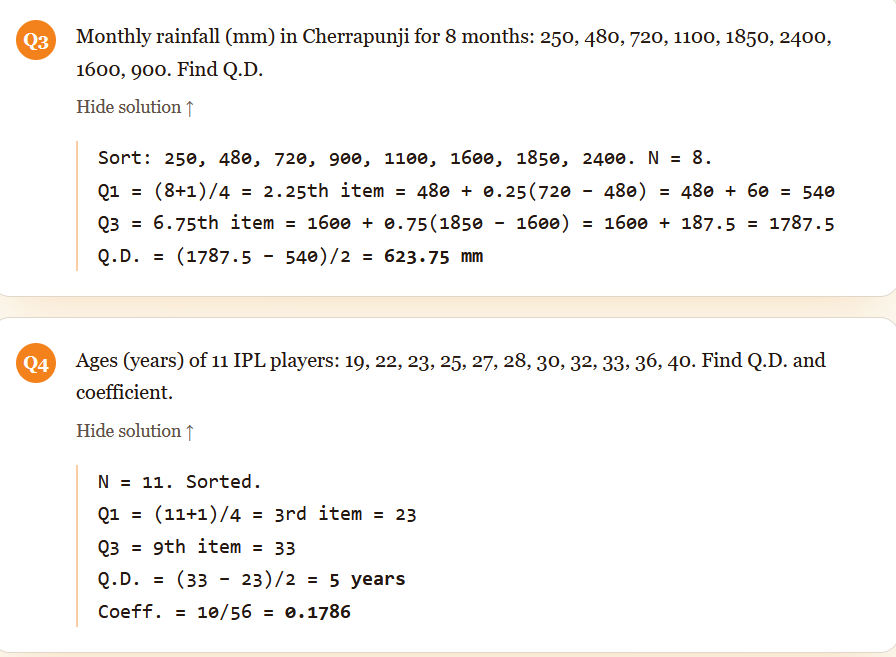
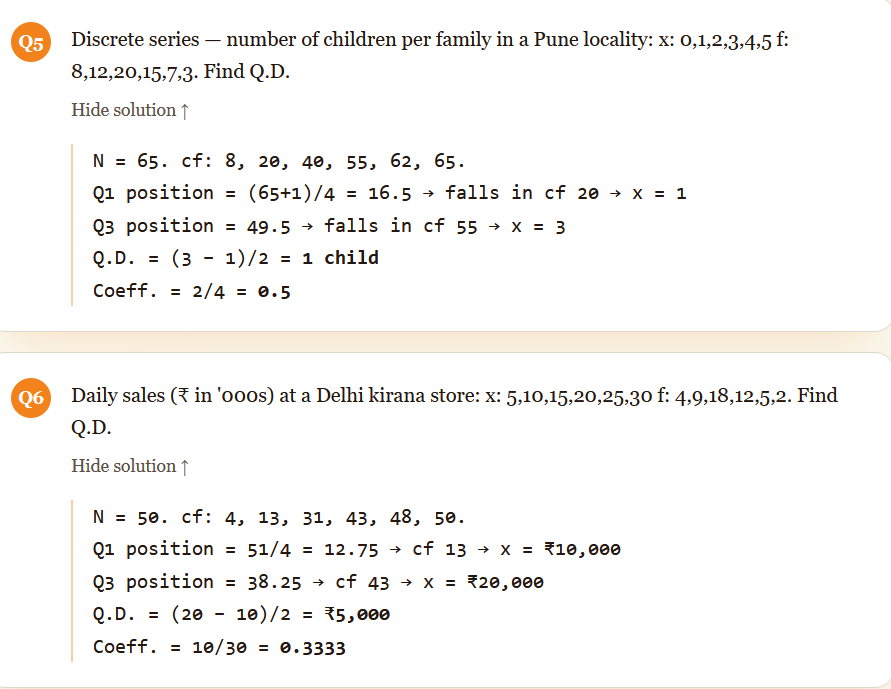
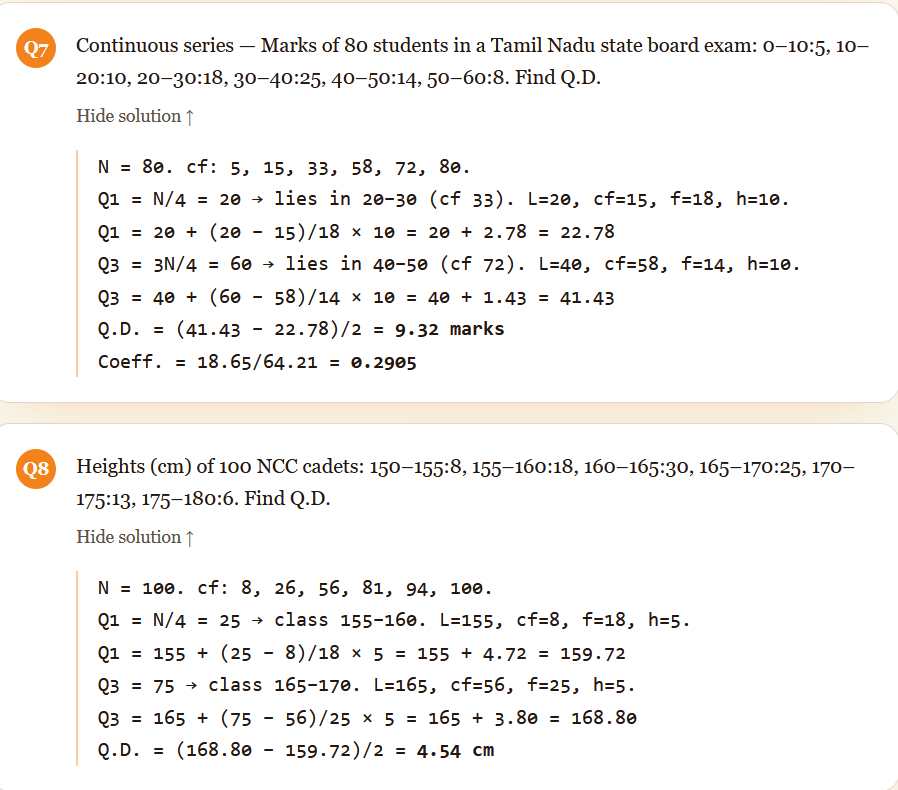
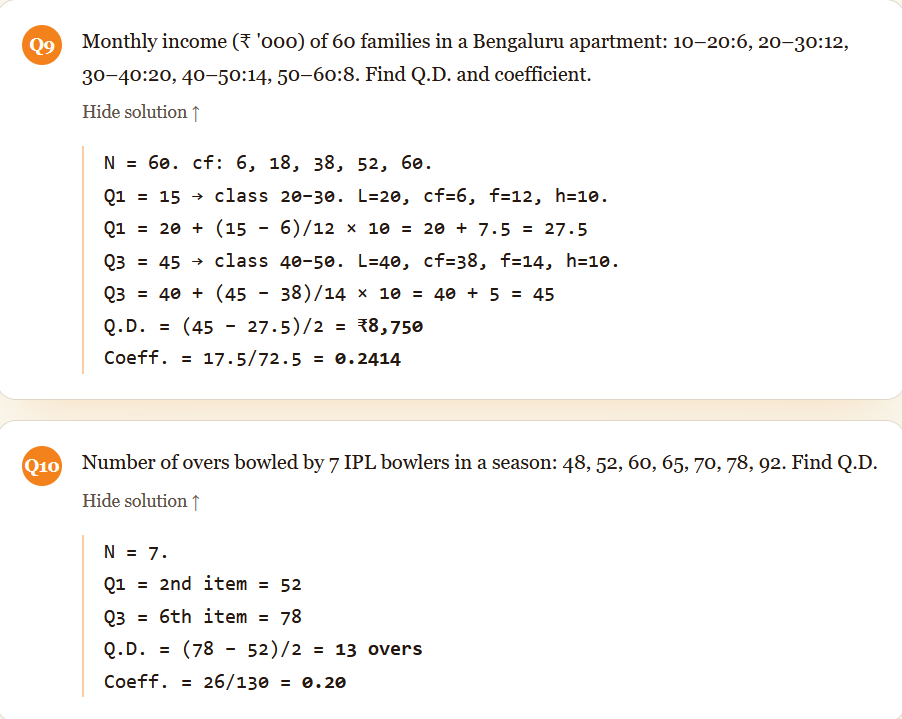
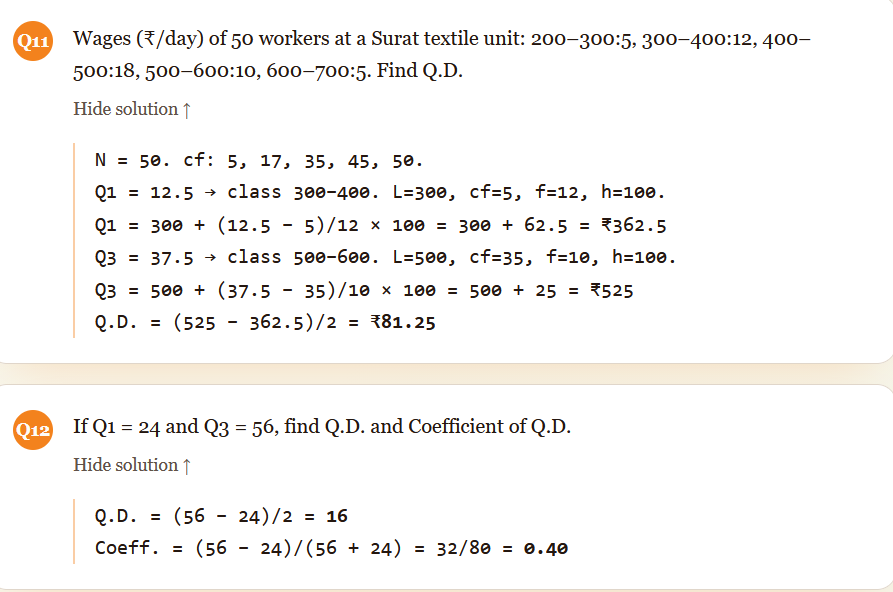
6) Solved Problems
7) When to use Quartile Deviation
- When data has outliers: A village wage list with one Ambani-cousin will break Range. Q.D. ignores him.
- Open-ended distributions: If the lowest class is “Below ₹500” or the highest is “Above ₹50,000”, Range can’t be computed. Q.D. comfortably can.
- Skewed data: Indian income, land-holding and urban housing data are heavily skewed — Q.D. handles it gracefully.
- Quick exam-friendly answer: Less calculation than Standard Deviation, more reliable than Range.
8) Limitations
- Ignores 50% of data: Only Q1 and Q3 matter; the bottom 25% and top 25% are thrown away.
- Not based on all observations: So it’s not a true measure of dispersion in the strict sense.
- Not capable of further algebraic treatment:Unlike Standard Deviation, you can’t combine Q.D. of two groups easily.
- Affected by sampling fluctuations: Different samples can give noticeably different Q.D. values.
- Doesn’t show the pattern: Two very different distributions can share the same Q.D.
Swathika B is an MBA graduate in Finance & Business Analytics , the founder of The Commerce Lab. With a strong academic foundation in B.Com BFSI and hands-on experience in financial analysis, data analytics, and business studies, she created this platform to make Commerce and Accountancy simple, practical, and exam-ready for students across India.